
Fundamental of Database - Part 2 : SQL Query Planner with Explain
When juggling with a large of data, it is really crucial to know what the database decides to execute our query for optimal performance. Moreover, if we have created index on our data, we need to know whether our query is affected by the index or not? If in the fact the created index doesn’t have any affect, we should identify how to improve or to modify the query.
In PostgreSQL, I typically use EXPLAIN syntax to analyze the query plan chosen by the database. Previously, I only checked the execution time to see how long my query took, but I didn’t fully understand the other descriptions provided. So in this section, - just like the previous writing - I continue to summarize what I have already learned about SQL Planner.
Before we jump into practice, let’s discuss first about Page, Heap, and Index in database.
Page
Typically, when a database reads or writes data, it operates on pages, not on individual rows. Each page can fit many rows (depends on how many columns, rows, data type etc). Each DBMS has default page, in PostgeSQL the default page is 8 KB (You can observe this in your database client when an empty table is created, as it will show a size of 8 KB). For example, if we have 1001 data rows and each page contains 4 rows, then the database has 1001/4 ~ 251 pages. We can use this query to retrieve the information about estimated number of pages and rows:
SELECT relpages, reltuples FROM pg_class WHERE relname = 'table_name';
Heap
Heap is collection of pages. It stores everything about table information. When a data is inserted into a table, it is stored in the heap.
Index
Index in a database is another data structure, seperated from the heap but has pointers to the actual data in the heap. It can be illustrated using the analogy of a dictionary. In a dictionary, the words are indexed by the alphabet. When you need to check a word that starts with certain letter, you can quickly jump to the section, rather than checking each page one by one.
EXPLAIN
Now, let’s discuss about EXPLAIN command in PostgreSQL:
EXPLAIN [ ANALYZE ] [ VERBOSE ] statement
Stated from PostgreSQL documentation:
- EXPLAIN: Show the execution plan of a statement.
- ANALYZE: Carry out the command and show the actual run times (Keep in mind that the statement is actually executed when ANALYZE is used)
- VERBOSE: Show the full internal representation of the plan tree, rather than just a summary. Usually this option is only useful for specialized debugging purposes.
Let’s prepare the data in the database:
CREATE TABLE table_a (
    id integer not null primary key,
    name varchar
)
I insert the data use generate_series up to 4000,000 data.
insert into table_a(id, name)
SELECT generate_series(1, 4000000), 'Name' || generate_series(1, 4000000)::text;
Then let’s play the query and see what’s the database choose to plan:
explain select * from table_a;
And here is the result of command above:
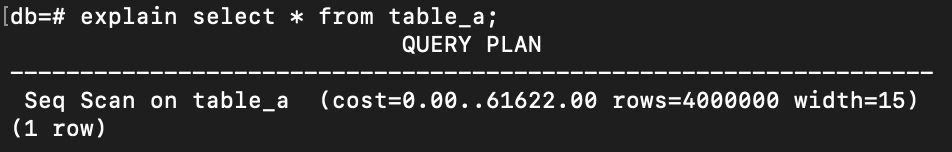
Note: If the result is more than one line, always read the analysis from bottom to top:
Before discussing scanning types, there are 3 outputs that are usually shown:
- Cost: Always has 2 numbers seperated by 2 dots. The first number (0.00) represents
Estimated start-up cost, which indicates approximately how many milliseconds the database takes to fetch the first page. In this case, it’s 0.00, meaning it cost almost nothing to get the initial result. But if this number increases, that indicates the database has to do a lot of stuff before fetching the result. Let’s try ordering the query above by id:explain select * from table_a order by id;See the difference of the start-up cost:
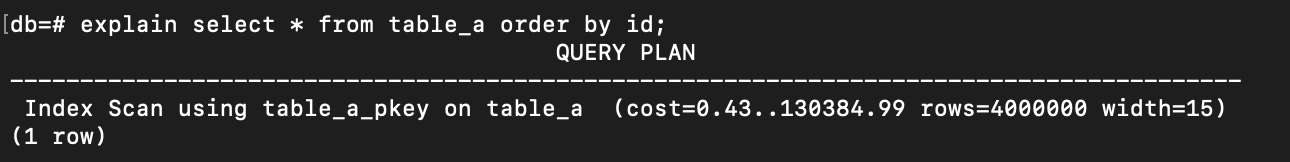
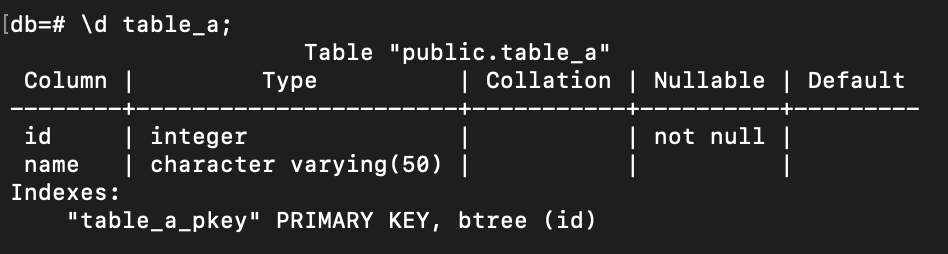
Even though the difference is not significant (as it’s affected by the index — the primary key has an index by default, you can check the picture below:
 ), but the database still needs to do a task before fetching the result.
The second number (61622.00) is the
Estimated total cost, showing the estimated total time to finish fetching all data. -
Rows:
Estimated number of rows. - Width:
Estimated average width, which is the estimated width of output row in bytes. So, it’s highly recommended to select only what is needed in the query (not using select *) to minimize the width of the returned data.
REMEMBER that the cost, rows and width in EXPLAIN is just an estimation, not the actual data. We can add ANALYZE command to actually execute the query.
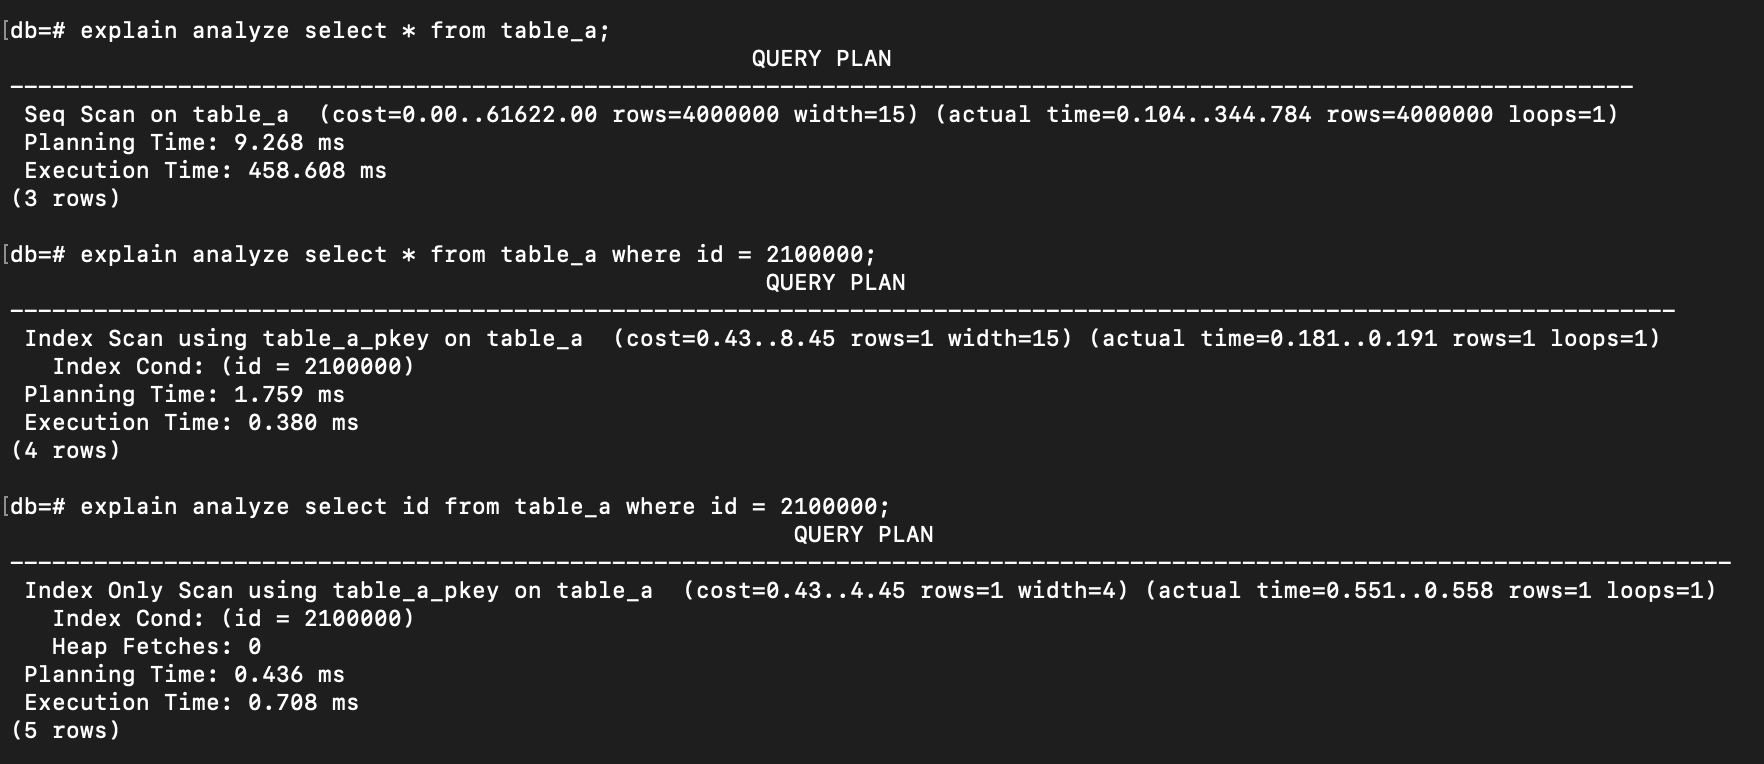
Now, let’s try EXPLAIN ANALYZE command and execute these queries:
explain analyze select * from table_a;
explain analyze select * from table_a where id = 2100000;
explain analyze select id from table_a where id = 2100000;
And the result:
-
Actual Time: Same as
costthat has the 2 numbers, represents thestart timeandend timeof the actual time to execute each step of the query. -
Loops: How many times that step was repeated.
-
Planning Time: Time for database to plan and to decide what to do with the query. For example: what kind of scan to execute it.
-
Execution Time: This is the actual work to go and do the work.
-
Heap Fetches: In the third query, we can see that the
Heap Fetcheshas a value of 0, meaning the query only accesses the index because that is the only thing being selected (select id). The database does not need to go to the heap (where all the detail information for id = 2100000 exist) since the id is already presented in the index.
Sequential Scan
If we look from the first example result, there is stated Seq Scan on table a. Sequential Scan is the same as Full Table Scan, it’s just the terminology in PostgreSQL. This means that the database decides to read the entire pages to get the desired data.
Another query example:
explain select * from table_a where name = 'Name 1000000';
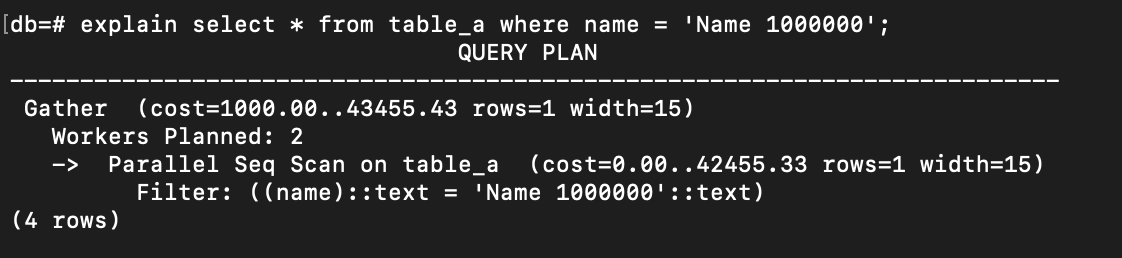
The name column has no index, so the only way to execute the query is Sequential Scan. However, we can notice Parallel Seq Scan and Workers Planned in the output. These mean that PostgreSQL scan the table sequentially, but in parallel, execute it on multiple threads.
Indexing Scan
Now, let’s try another 3 different queries and see what the database decides to plan:
explain select name from table_a where id = 1000;
explain select name from table_a where id < 1000;
explain select name from table_a where id > 1000;
And here is the result:
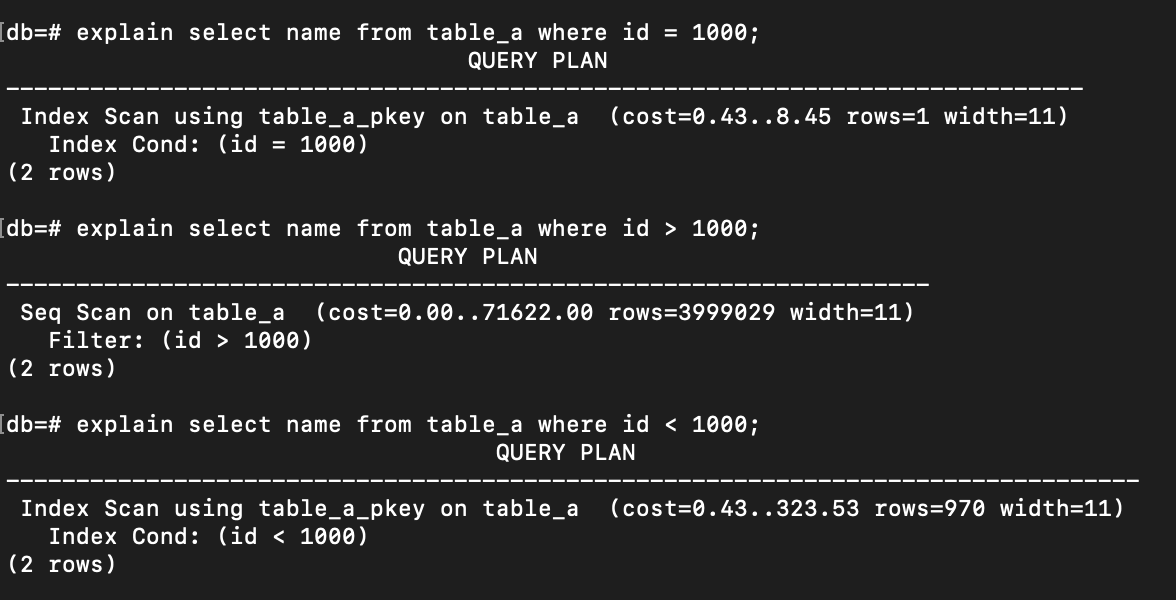
When the data consists of only a small set of rows, the database decides to use the Index Scan.
However, in the second query where the estimated number of rows is large (see the estimated result is more than 3 million rows), the database switches back to using a Sequential Scan.
In this case, scanning the index and checking each row to see if it meets the condition is way more expensive than simply scanning all pages and filtering out the unnecessary rows. That’s why the database decides to use Sequential Scan.
Index Scan vs Index Only Scan
Let’s check the plan for these queries:
explain select name from table_a where id = 80;
explain select id from table_a where id = 80;
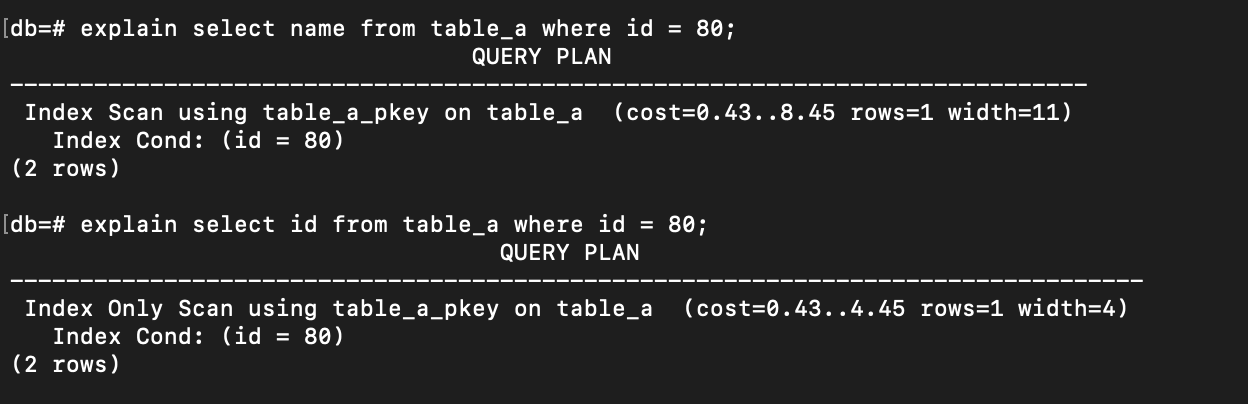
The difference is only on the column to be selected. When selecting name (that is no index), it’s using Index Scan and when selecting id (that has index), PostgreSQL will use Index Only Scan (which can lead to heap fetches = 0 as I mentioned earlier).
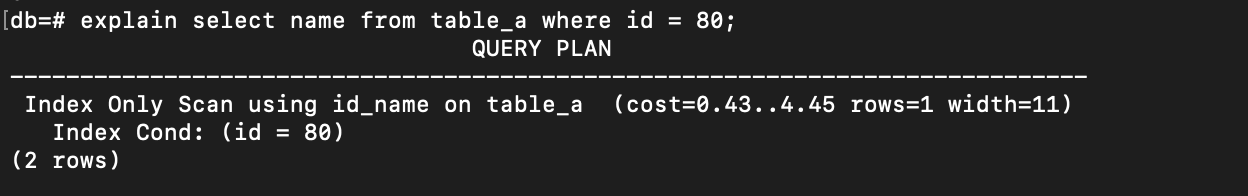
So how If I want PostgreSQL to use an Index Only Scan when selecting the name column?
We can create an index on id with name as a non-key column:
CREATE INDEX id_name on table_a(id) include(name);
And see the result now:
Bitmap Scan
I add new column (grade) and insert it with random value, then create an index on it:
ALTER TABLE table_a ADD COLUMN grade INTEGER;
UPDATE your_table
SET grade = 10 + FLOOR(RANDOM() * 91);
CREATE INDEX index_grade ON table_a (grade);
Now, let’s try to check SQL planner for this query below:
explain select * from table_a where grade > 90;
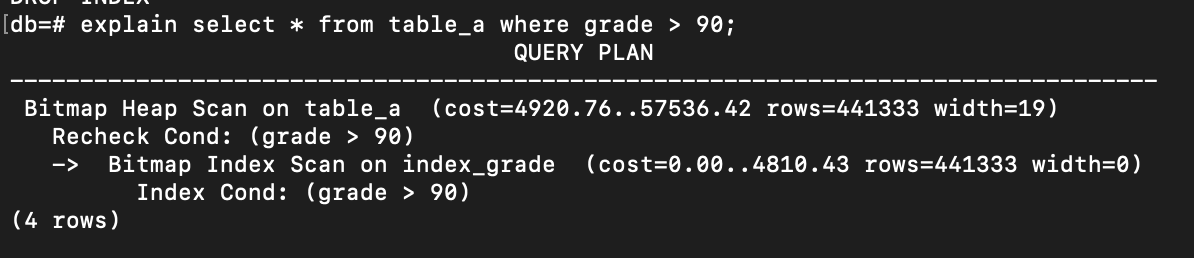
There is already an index on grade, but PostgreSQL also knows that the returned set of rows is too large. So, Bitmap Index scan happens in this case, when it is too expensive to use index scan, but also not ideal to use sequential scan.
When using Bitmap Scan, PostgreSQL is going to build a bitmap (basically an array of bits) where the value represents the page number (bit number zero is the page number zero and so on).
- At the first, PostgreSQL will do the index scan that meets the condition (
Index Cond: (grade > 90)). - Then gather those pages until the end of scan to become a bitmap. Remember that each page contains many rows, so for the pages that contain qualifying rows, the bit sets to 1, and for pages that do not have filtered rows, it sets to 0.
- After all of relevant pages are collected, the PostgreSQL performs
Bitmap Heap Scanto access the pages marked as 1 and do rechecking (represented byRecheck Cond: (grade > 90)) only to select the rows inside the page that meet the condition.
Fortunately, the example above has the same estimated number of rows before and after rechecking.
That’s it.